Portfolio Structure Policy
Ownership period
HHR shall acquire and manage properties on the premise of long-term ownership.
Zoning and investment ratio
Emphasis on investment in retail-use zones
HHR shall invest in retail-use, office-use, complex facilities in which these two types coexist, and other facilities.
In principle, retail-use zone investment as a percentage of the total investment amount of the entire portfolio shall be 50% or more (on an acquisition price basis) as of the end of each fiscal period.
In principle, investment in Zones for other use shall be 10% or less (on an acquisition price basis) as of the end of each fiscal period.
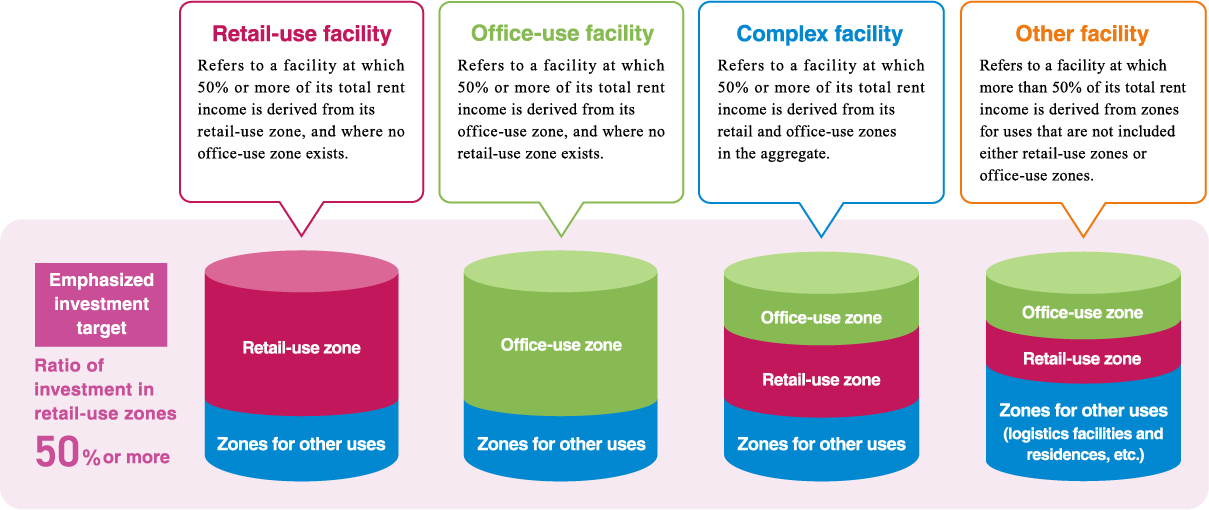
"Retail-use zone*" refers to a zone in which visitors receive goods and services in return for payment at offices, stores, restaurants, amusement facilities, clinics, private preparatory schools (juku), schools, beauty salons, rental meeting rooms, halls, theaters, hotels and entertainment facilities, as well as a supplementary zone that provides goods and services.
"Office-use zone" refers to a zone and a supplementary zone intended for office use.
As for “Other facility”, HHR may invest in those that conform to the basic policy of HHR, after carefully examining the content of each investment target. In principle, investment in “Zones for other use” is allowed when they are logistics facilities or residences; however, investment in such zones is also allowed only when they are attached to or part of the facilities listed above (note that “Other facility” here refers only to those that have logistics facilities or residences as their main zone).
- For Hotel-use zone within "retail-use zone", in principle, the share of the hotel-use portion shall not exceed 20% of the entire portfolio.
Region and investment ratio
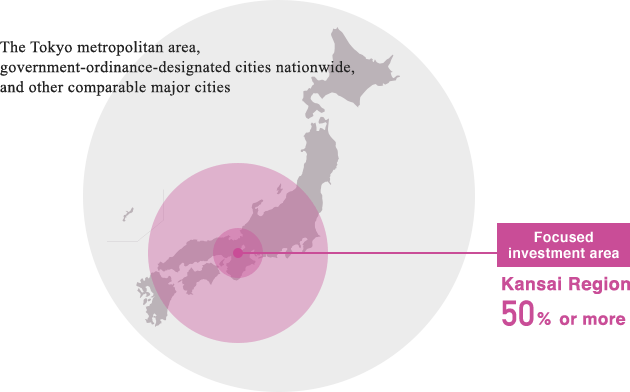
Investment focus on the Kansai Region
Investment target areas of HHR shall be the Tokyo metropolitan area, government-ordinance-designated cities nationwide, and other comparable major cities. In principle, investment in the Kansai Region shall be 50% or more of the entire portfolio (on an acquisition price basis).
Gross product of the Kansai Region - equivalent to the eighteenth in the world
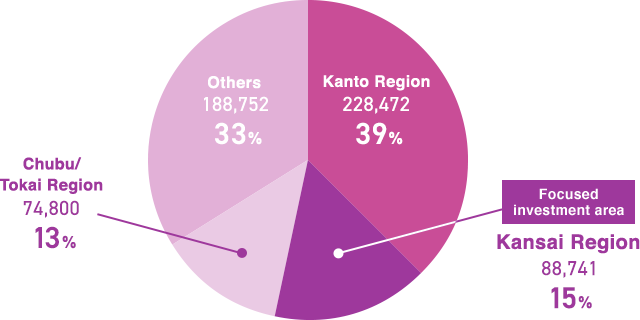
The gross product of the Kansai Region in fiscal 2019 was about 15% of Japan's gross domestic product (GDP). In comparison with foreign nations, Kansai's gross regional product exceeded the 2019 GDP of Saudi Arabia, which ranked 18th, and Turkey, which ranked 19th.
Fiscal 2019 GDP (Billions of Yen)
Comparison with GDP of foreign nations (Billions of US Dollars)
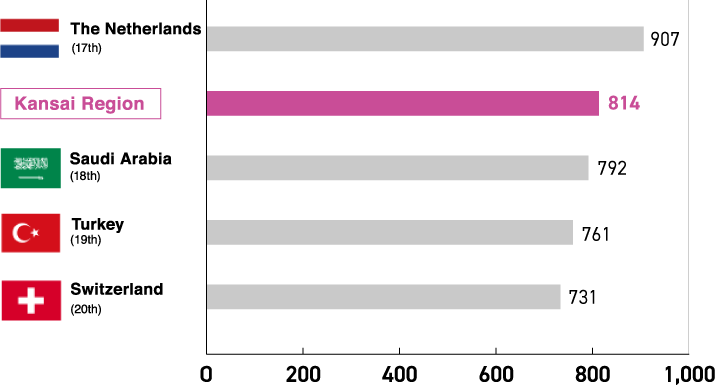
Foreign nations: The Statistics Bureau of the Ministry of Internal Affairs and Communications, Chapter 3 National Accounts, 3-2 Gross Domestic Product (in U.S. dollars) (2019) in Sekai-no-Tokei (The World Statistics) 2022.
- The above graph juxtaposes GDP in foreign nations in calendar year 2019 and gross regional product of the Kansai Region in fiscal year 2019.